





















01
Necessary Always on
Required for the site to work (login, preferences, security). Always on.
GPU inference claims mix a preview score, a cloud list price and a vendor blog into one number. Here is what to check before treating any $/token figure as fact.
MSP buyers asking "what does inference cost?" tend to get an answer built from three different instruments taped together: an accelerator, the memory sitting next to it, and the software that keeps the chip busy. A preview benchmark score, a cloud list price and a vendor blog post do not collapse into one honest dollar-per-token figure, and treating them as if they do is how buyers end up comparing the wrong things.
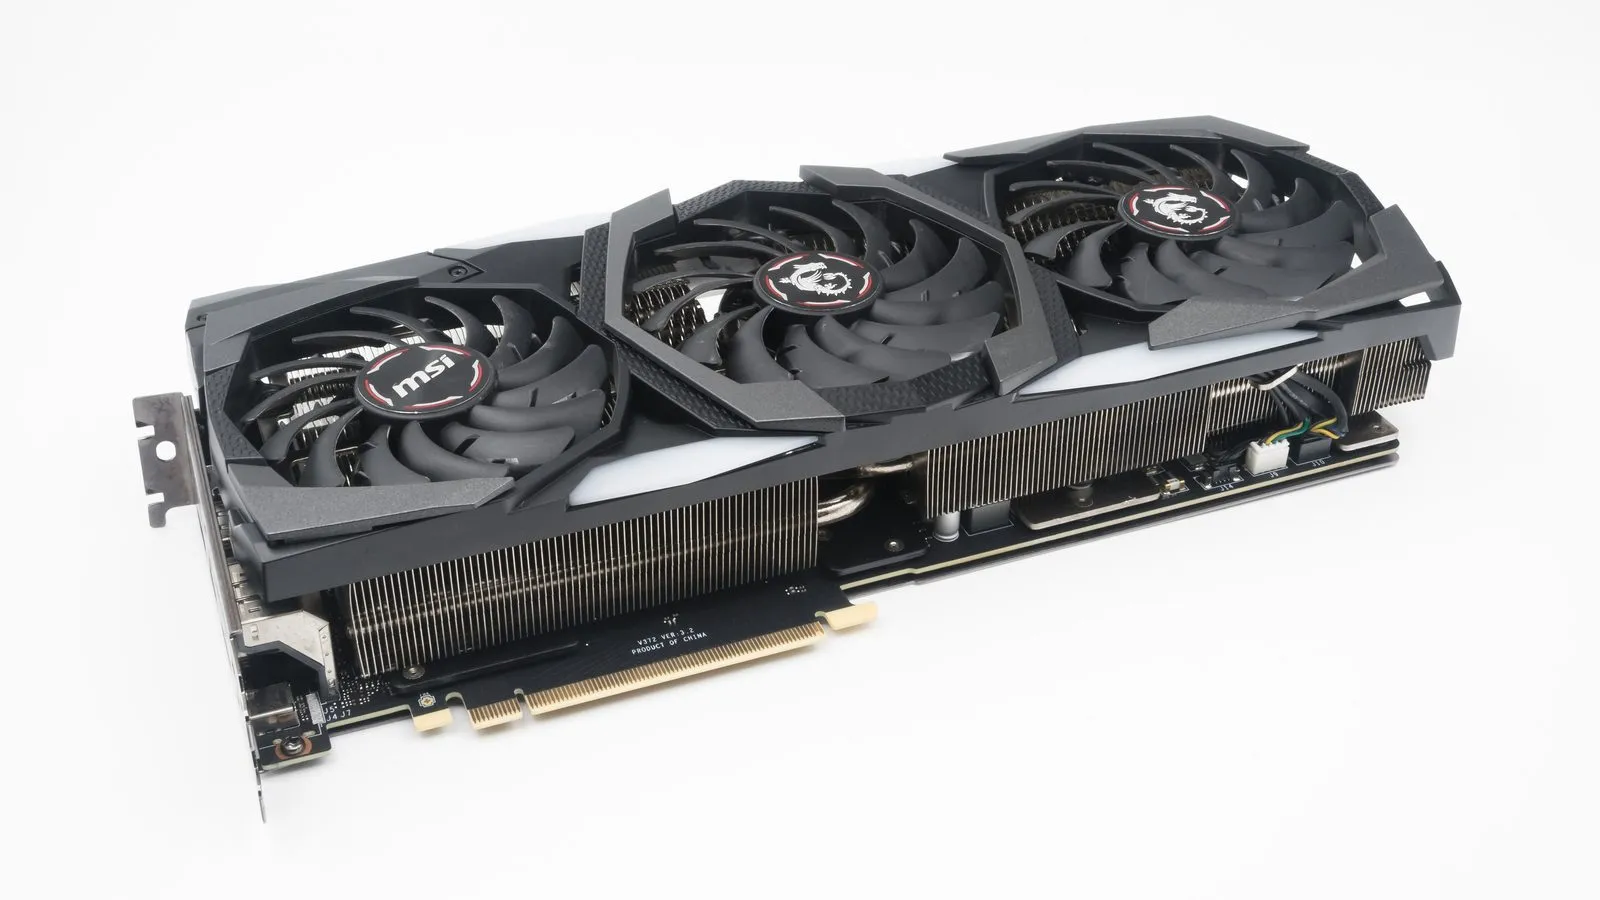
Memory bandwidth decides whether a large model spends its time doing math or waiting on weights to arrive. A rack that wins a dense throughput test can be the wrong purchase for traffic that is short, bursty and intolerant of queueing. Software moves the same silicon by a large margin, too: the runtime, kernel library and scheduler are part of the result, not a footnote. If two vendors' submissions don't pin the same software stack, the gap between their numbers is not a law of physics — it's a difference in tuning. NVIDIA's own MLPerf Inference v6.1 submissions, for instance, reported up to 1.6x higher performance than the same hardware scored in v6.0, purely from software optimization.
A relative speedup against a named predecessor is not an absolute crown, and MLCommons is explicit that Preview results are not proof of stable rental economics or broad availability. A rented GPU-hour is also not your fully loaded cost: power, networking, idle capacity and the staff keeping a cluster full all sit outside the bar chart. Ask which model, which precision and which date produced the number. If any of those three is missing, you don't have a result — you have a slogan.
Use benchmark claims as a starting point for your own proof-of-concept, not as a substitute for one. Gate any vendor's inference-cost pitch on your own workload, your own software stack and your own service-level requirements before it reaches a contract.
Sources: MLCommons, NVIDIA Blog.