Every device.
One clear view.
Monitor endpoints, discover network equipment and follow alerts across client sites. Keep the device, its metrics and its location in the same workspace.
Windows · macOS · Linux
Synology · UniFi · MikroTik · Redfish · SNMP
Loading the Pulse console…
Review the online and offline devices, then follow the recent alerts.
Real product components. Try the device search, open a device, change a chart period or acknowledge an alert.
Your infrastructure is connected. Your monitoring should be, too.
Pulse connects endpoints, network equipment and site context in one workspace. Built for MSPs who need to understand the whole environment, then decide what needs attention.
Built for the way
MSPs work.
A device rarely tells the whole story. Connect the metrics, network and context around it.
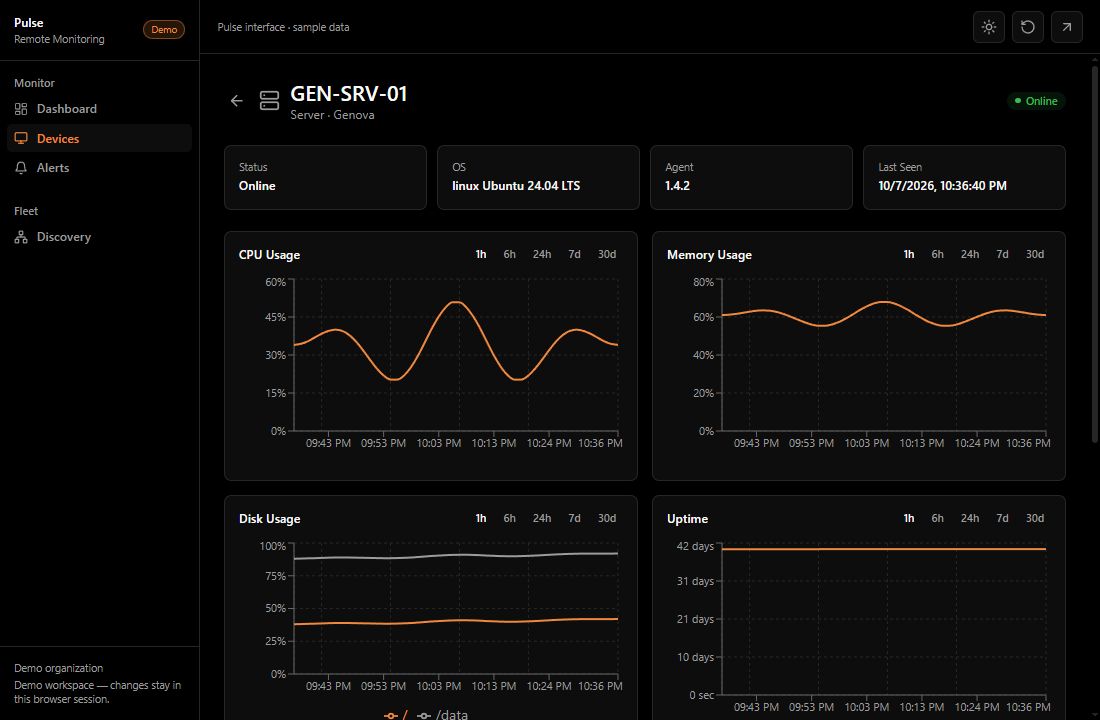
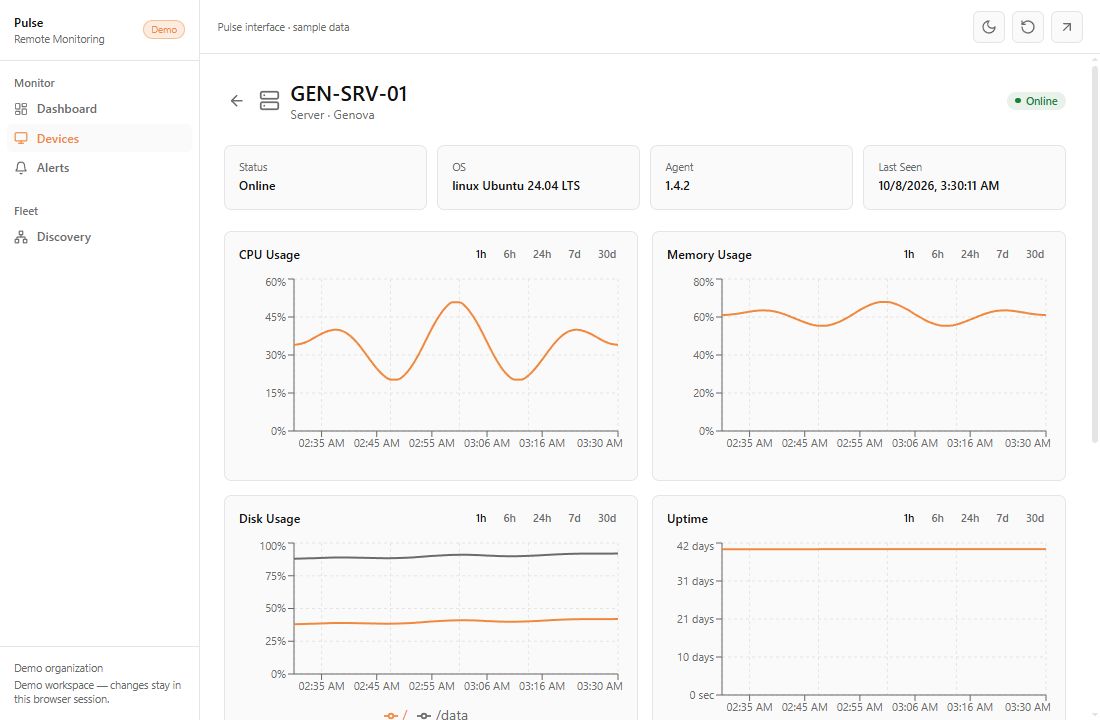
Endpoint monitoring
System metrics, device inventory and site context, in one place.
Explore capability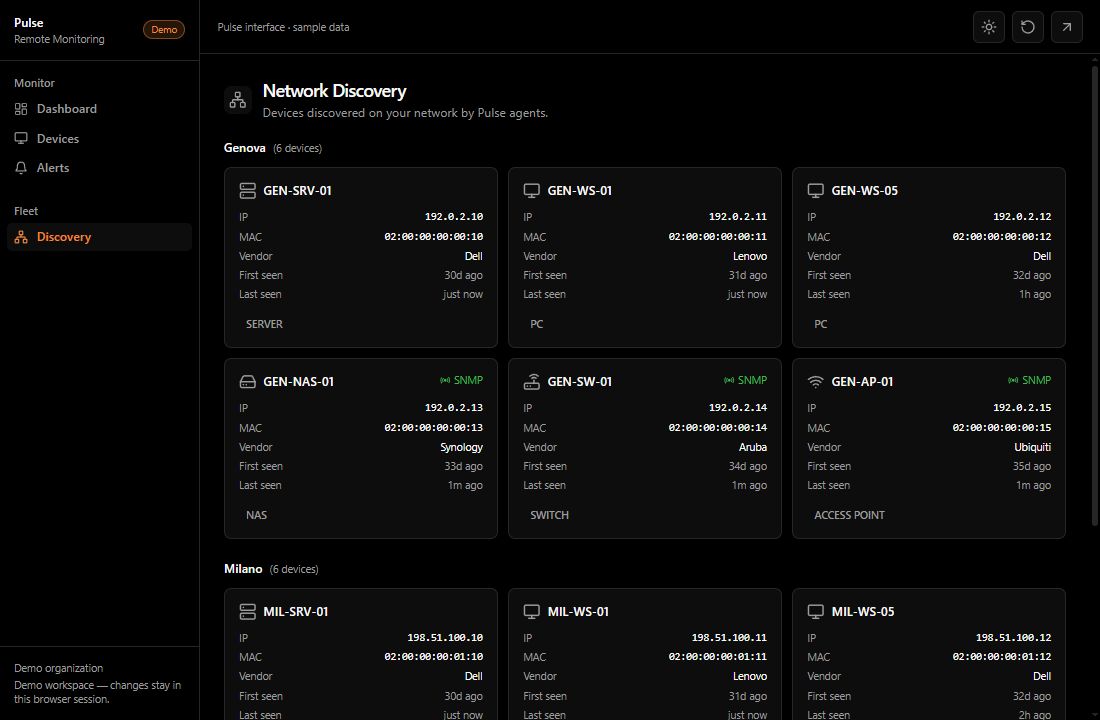
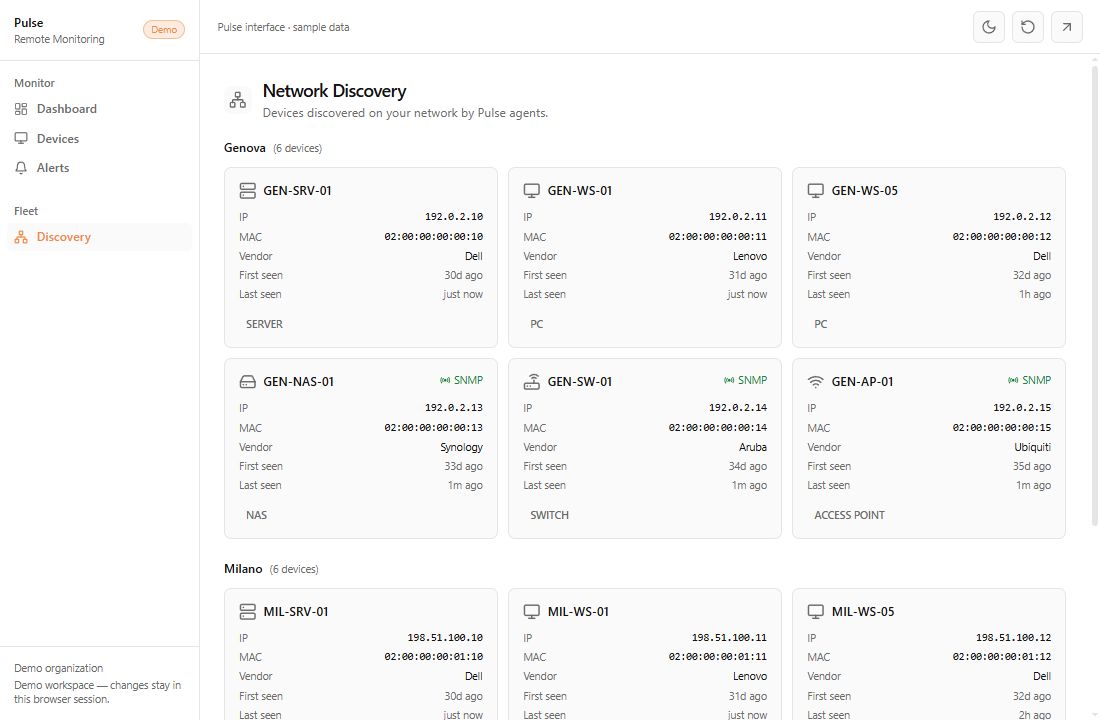
Network discovery
Bring discovered devices and vendor metrics into the same picture.
Explore capability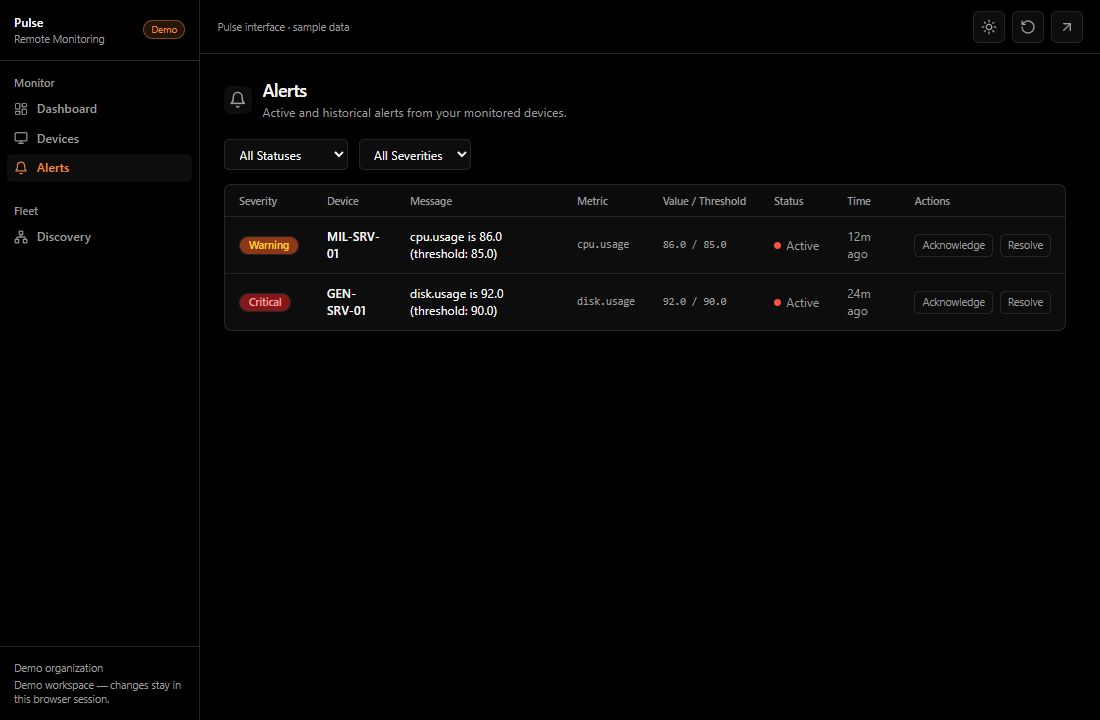
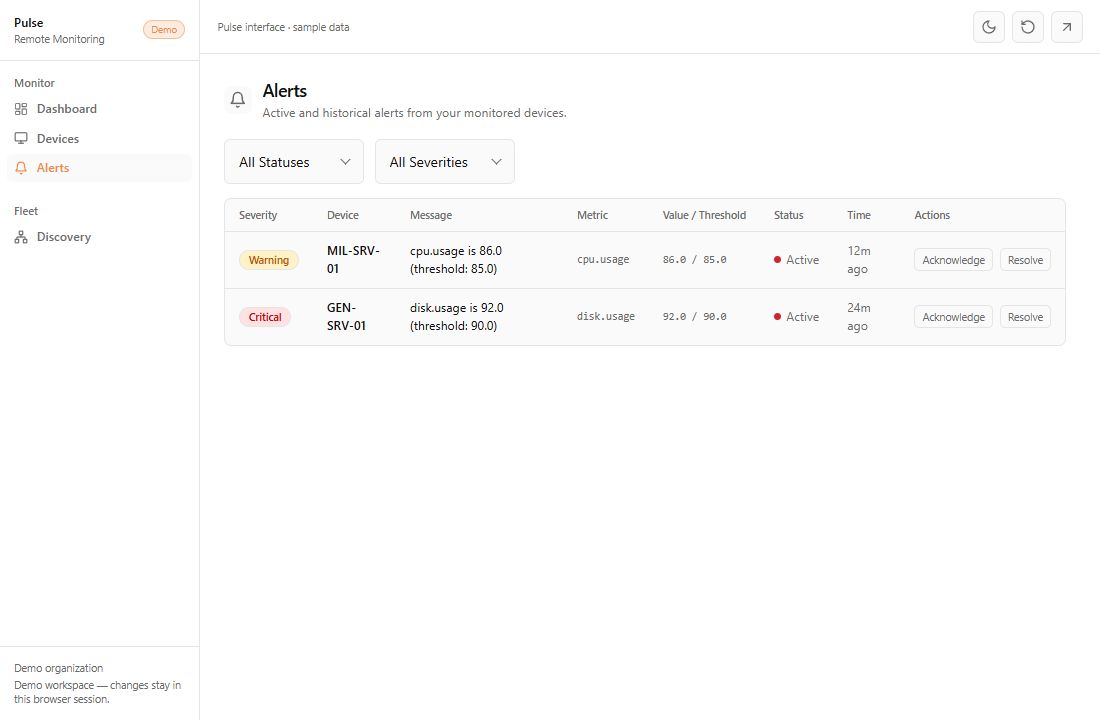
Actionable alerts
Define the signal, keep the device context, and track what happens next.
Explore capabilityThe example logs show repeated backup writes. Check the destination, retention settings and available space before changing the backup schedule.
02:14 backup-worker write /volume/backup02:16 disk.usage 87% → 91%AI-assisted log analysis
Use the collected evidence to guide your investigation.
Explore capabilityHow Pulse works
Connect your infrastructure, explore your site inventory, and investigate the signals that need your attention.
Bring an endpoint into your workspace. Keep its identity, agent status, and latest check-in together.
A clear starting point for every endpoint.See discovered devices grouped by site, with their addressing details. Move from an isolated endpoint to the wider site inventory.
Infrastructure you can navigate.Follow host metrics and configured thresholds. Read recent activity before deciding what needs a closer look.
Signals with context, in one place.Explore logs with AI assistance. Use the evidence behind a signal to understand the next step.
A shorter path from a signal to an explanation.production-api-01
- Operating system
- Linux
- Agent status
- Reporting
- Last check-in
- Just now
14:21:06 INFO Request received14:21:06 WARN Upstream response delayed14:21:07 INFO Retry completedThe delayed response was followed by a successful retry. Review the upstream service and the surrounding logs.
Find the signal.
Keep the context.
Move from an alert to its device, from a device to its site, and from a symptom to the logs behind it. Keep the investigation in one connected workspace.
AI-assisted log analysisThe example logs show repeated backup writes. Check the destination, retention settings and available space before changing the backup schedule.
02:14 backup-worker write /volume/backup02:16 disk.usage 87% → 91%Device-level detail
CPU, memory, storage and uptime in context.
Site-level visibility
Understand what is connected and where.
Operator-led decisions
Acknowledge alerts and choose the next action.
Visibility at
every layer.
Useful tools for the infrastructure you actually manage.
System metrics
Track CPU, memory, disk and uptime across managed endpoints.
Network discovery
Find devices on the network and review them by site.
Vendor integrations
Read the hardware details generic metrics can miss.
Alert management
Define thresholds, review severity, acknowledge and resolve.
AI log investigation
Ask focused questions about collected logs with a configured AI provider.
Local relay
Bring site-local collection into Pulse with the optional NODE appliance.
From separate signals
to shared context.
A practical look at the workflow Pulse brings together.
| Your work | Separate tools | With Pulse |
|---|---|---|
| Find an endpoint | Manual asset lists | Device inventory with site context |
| Read its condition | A separate metrics view | System metrics on the device |
| Review network equipment | Multiple vendor dashboards | SNMP and configured vendor collectors |
| Follow an alert | A disconnected notification | Rule, severity and device in one view |
| Investigate logs | Manual file searches | Collected logs and AI-assisted questions |
Start with the systems you need to see.
From endpoint health to network visibility, shape Pulse around the environment your team operates.
A quotation tailored to your sites and devices.
Availability, capabilities and configuration are confirmed for your deployment during the demo.
Enter between 1 and 10,000 devices to prepare your discussion brief.
Carry your site count into the demo request.
Understand device health.
A starting point for teams that need to follow endpoints and their operational signals.
- Device inventory and endpoint metrics
- CPU, memory and disk visibility
- Configurable alert rules
Bring network devices into view.
Connect supported network equipment to understand the environment around your endpoints.
- SNMP monitoring for supported devices
- Vendor connectors with configuration
- Device metrics and alert rules
Plan visibility across locations.
Review your sites, devices and collection requirements to define a suitable deployment.
- Sites and monitored device organization
- Endpoint and network collection
- Optional NODE for local collection
Good questions.
Clear answers.
What does Pulse monitor?
Pulse collects endpoint metrics on Windows, macOS and Linux. SNMP and configured vendor collectors extend visibility to NAS, network equipment and Redfish-compatible servers.
Can I manage several client sites?
Devices, discovery results and alerts are organized by site inside the tenant workspace. You can move between an overall view and the context of a specific location.
Do I need a NODE appliance?
NODE is optional. It provides a local relay and collection point at a site. Agents can also send telemetry directly to the ingest service.
What does the AI assistant do?
It helps investigate collected device logs using context and log summaries. It requires an AI provider configuration and does not autonomously remediate devices.
How do I start?
Book a demo to map your devices, sites and integrations. The setup and commercial configuration are confirmed against your environment.