Metrics that matter
See CPU use, memory pressure, disk usage and uptime without switching context.
Follow CPU, memory, storage and uptime across Windows, macOS and Linux. Keep the device and its location connected to the metrics you review.
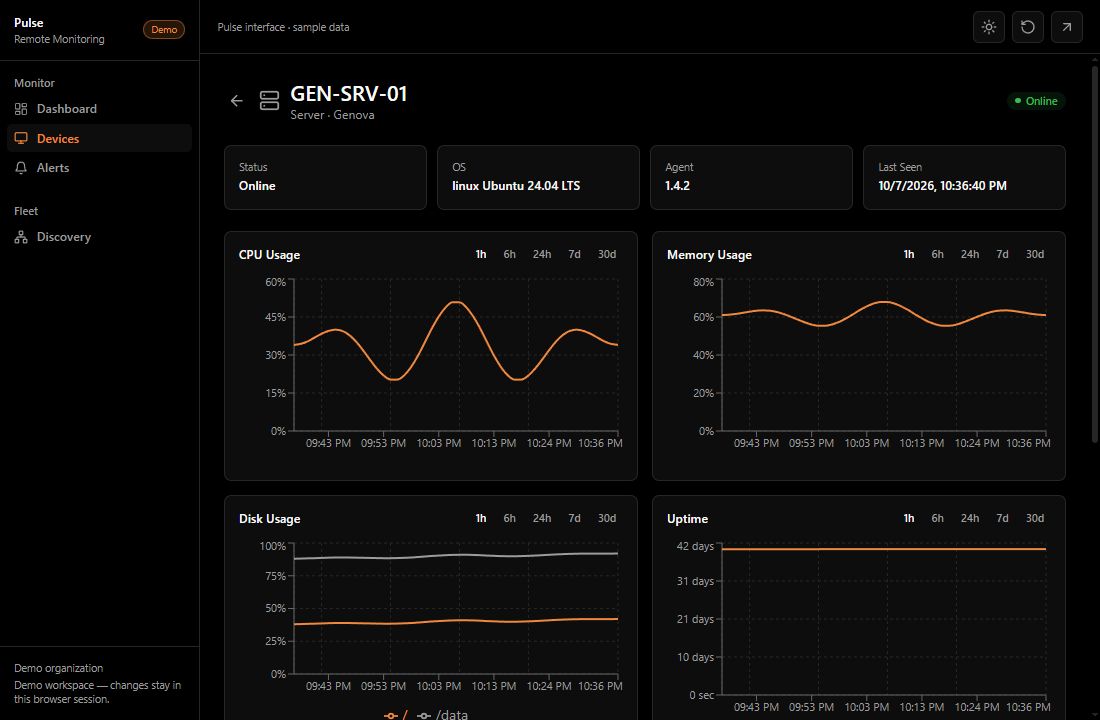
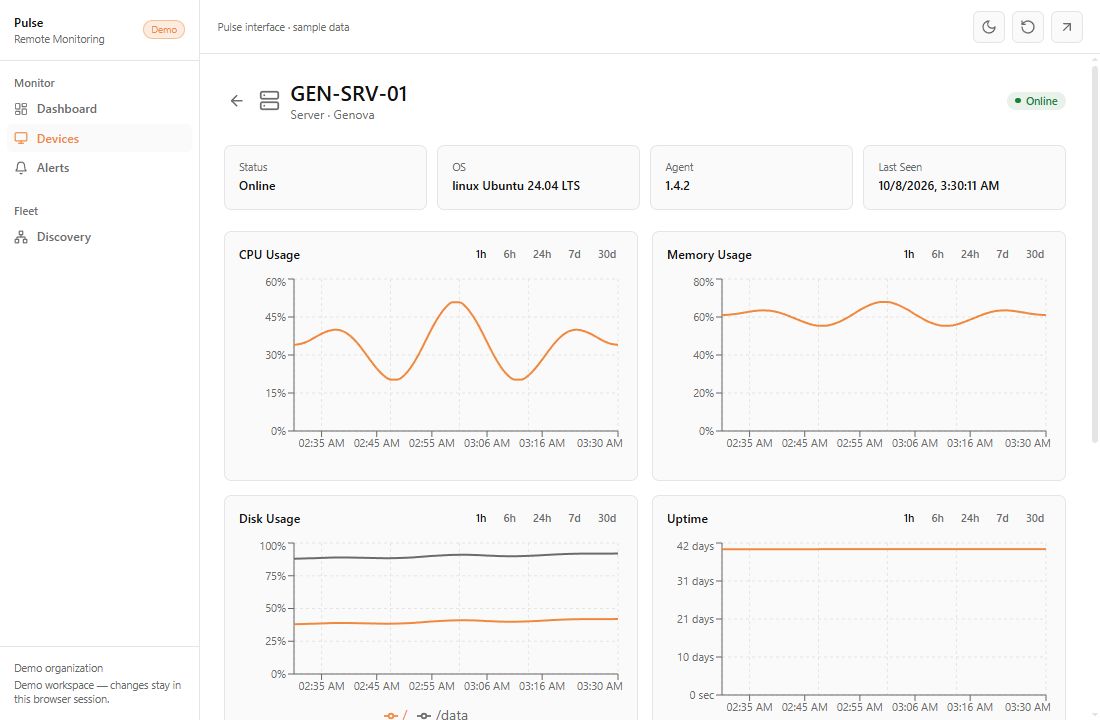
See CPU use, memory pressure, disk usage and uptime without switching context.
Review hostname, operating system, status and last-seen information for enrolled endpoints.
Organize devices by location and move from your inventory to the relevant site.
Available metrics depend on the operating system, agent configuration and connected hardware.
How it worksEnroll an endpoint with a site-scoped token.
Collect system metrics through the Pulse agent.
Review the device and its metric history in the console.
Loading the Pulse console…
Explore GEN-SRV-01. Change a chart period and inspect its hardware inventory.
Real product components. Try the device search, open a device, change a chart period or acknowledge an alert.