Your infrastructure.
Connected.
Endpoint metrics, network visibility, alert rules and log investigation. Explore the capabilities that bring the whole environment into focus.
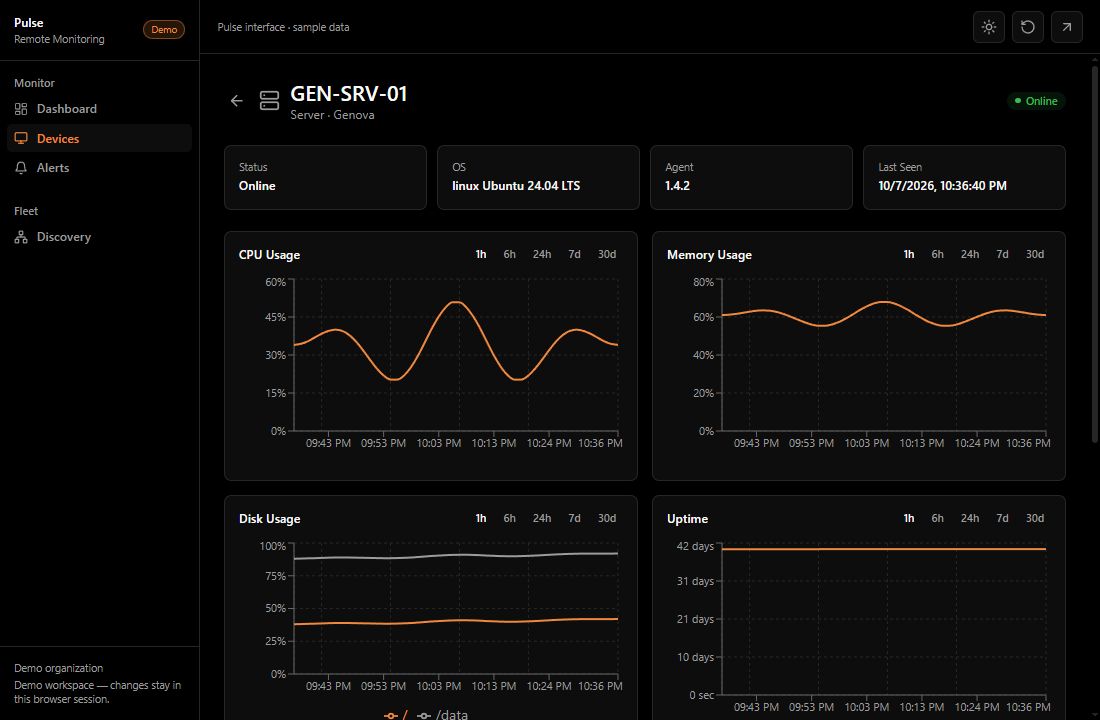
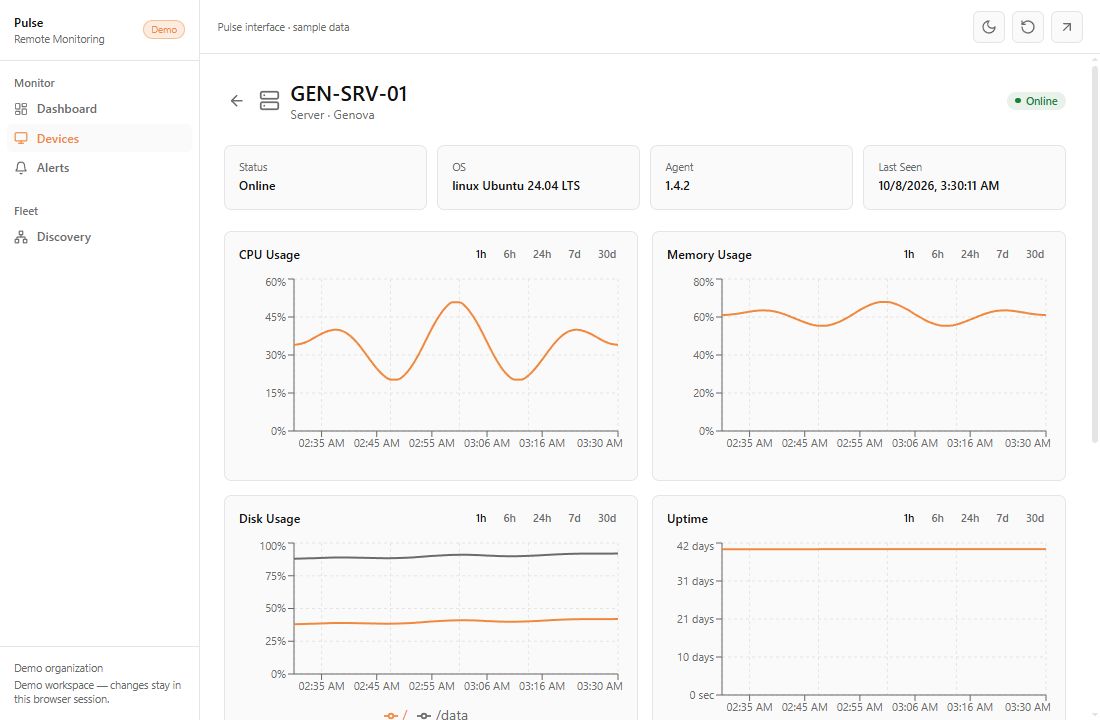
Endpoint monitoring
System metrics, device inventory and site context, in one place.
Explore capability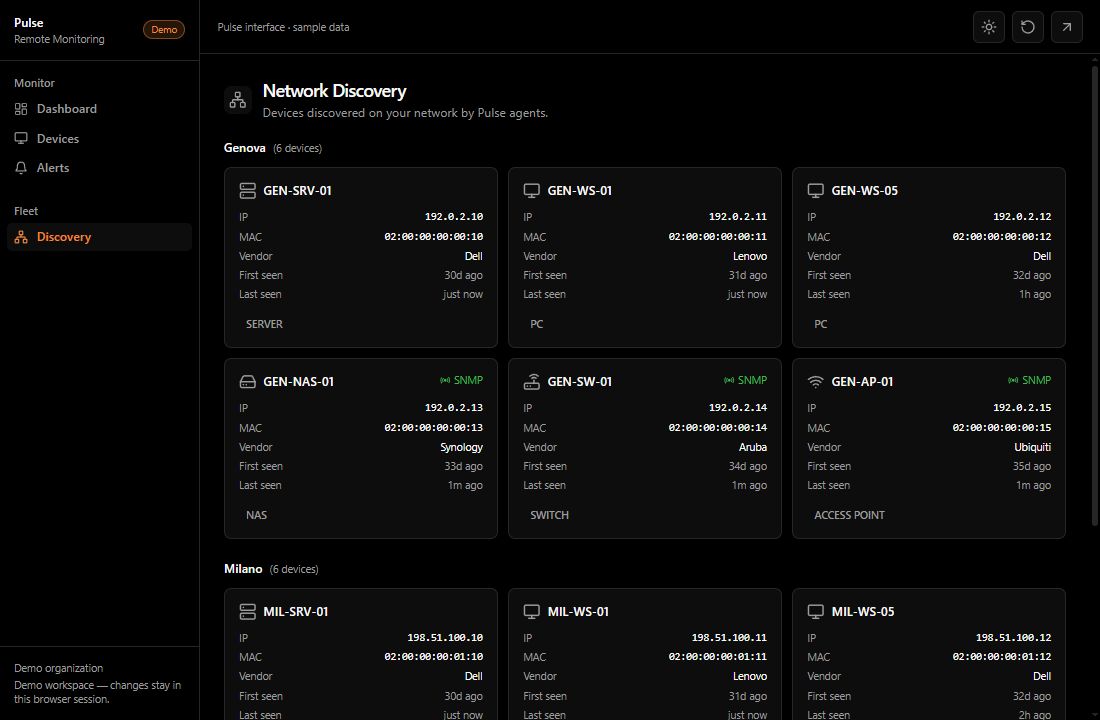
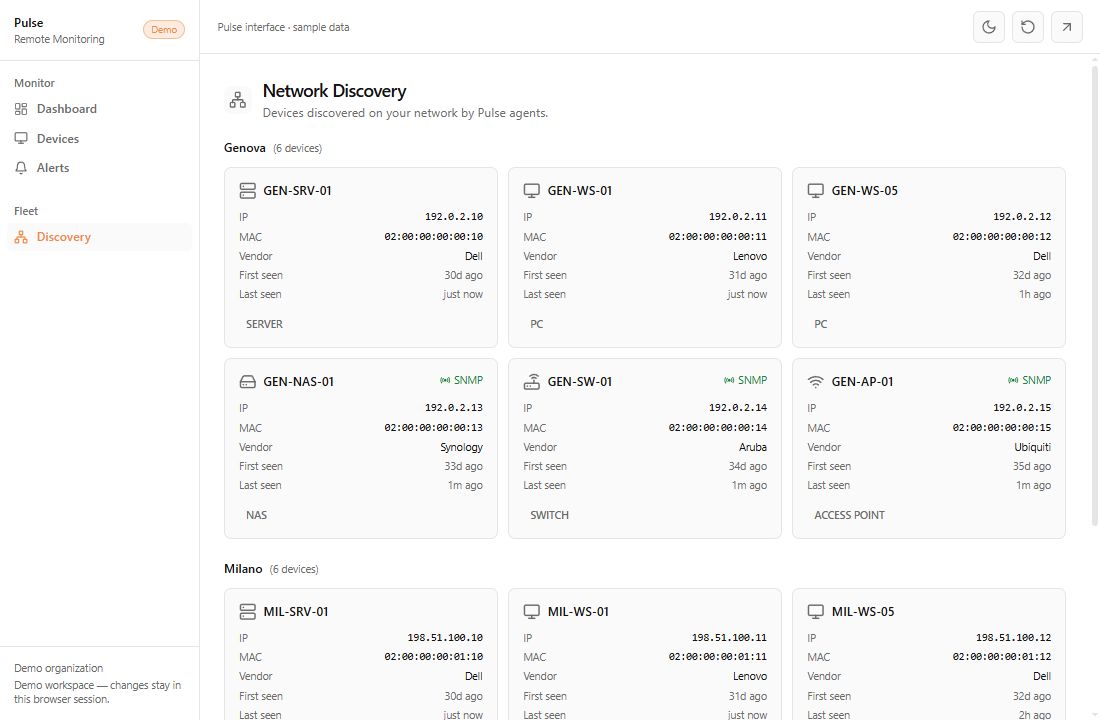
Network discovery
Bring discovered devices and vendor metrics into the same picture.
Explore capability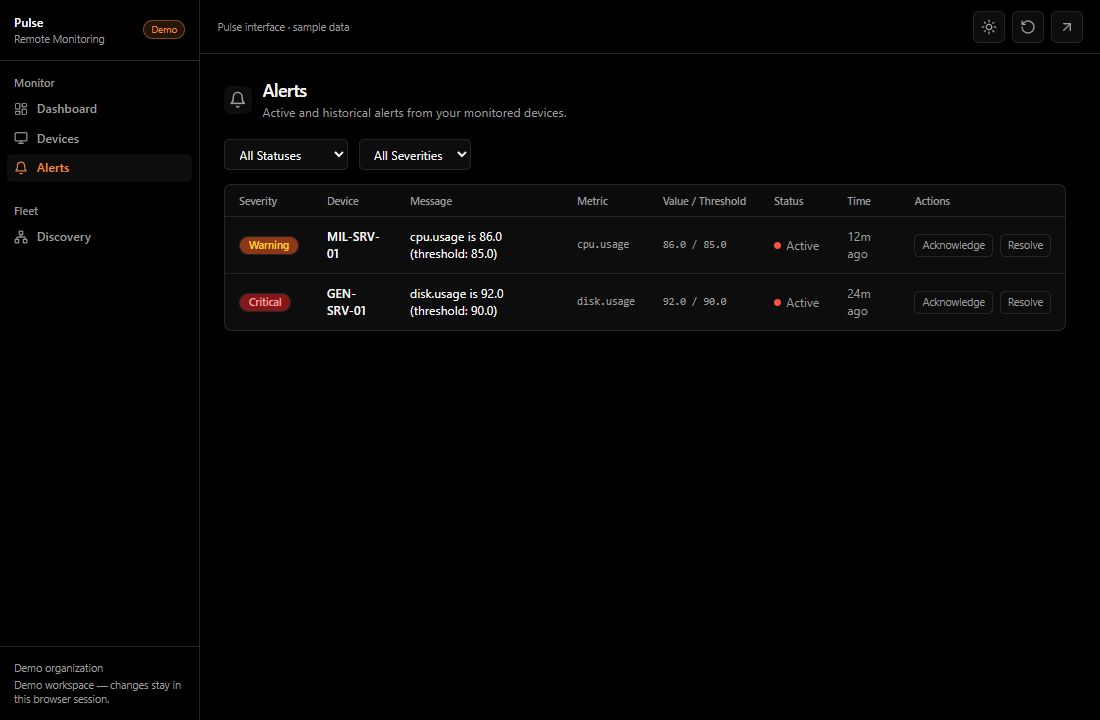
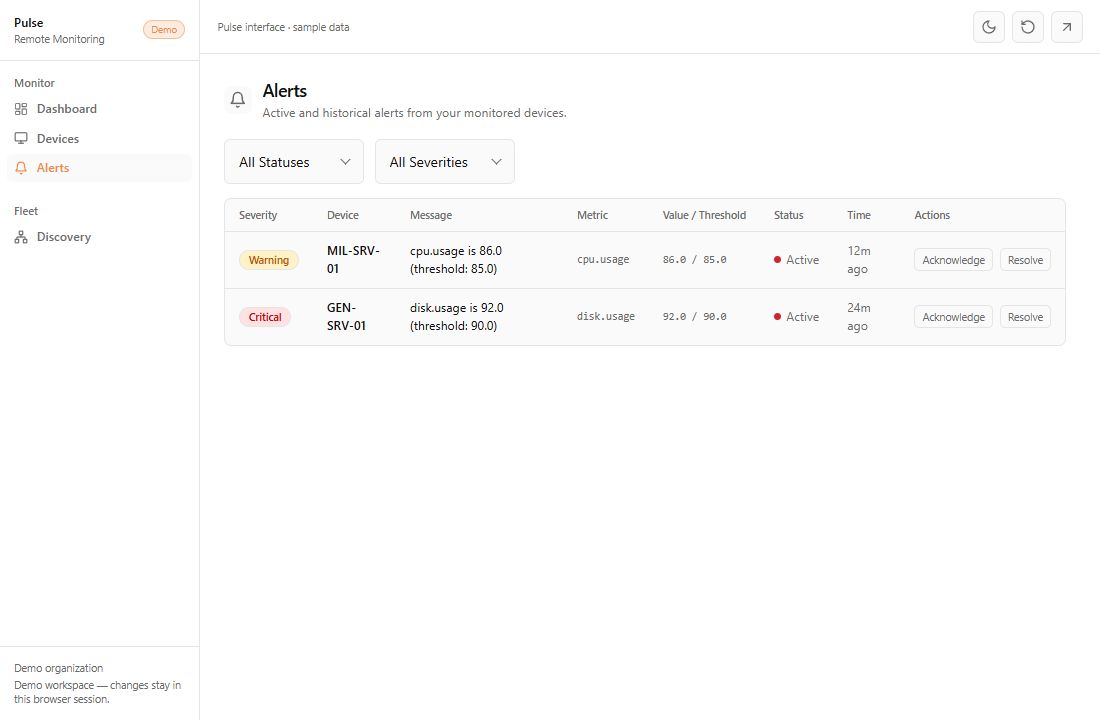
Actionable alerts
Define the signal, keep the device context, and track what happens next.
Explore capabilityThe example logs show repeated backup writes. Check the destination, retention settings and available space before changing the backup schedule.
02:14 backup-worker write /volume/backup02:16 disk.usage 87% → 91%AI-assisted log analysis
Use the collected evidence to guide your investigation.
Explore capabilityVisibility at every layer.
Useful tools for the infrastructure you actually manage.
System metrics
Track CPU, memory, disk and uptime across managed endpoints.
Network discovery
Find devices on the network and review them by site.
Vendor integrations
Read the hardware details generic metrics can miss.
Alert management
Define thresholds, review severity, acknowledge and resolve.
AI log investigation
Ask focused questions about collected logs with a configured AI provider.
Local relay
Bring site-local collection into Pulse with the optional NODE appliance.
Loading the Pulse console…
Review the online and offline devices, then follow the recent alerts.
Real product components. Try the device search, open a device, change a chart period or acknowledge an alert.
Good questions.
Clear answers.
What does Pulse monitor?
Pulse collects endpoint metrics on Windows, macOS and Linux. SNMP and configured vendor collectors extend visibility to NAS, network equipment and Redfish-compatible servers.
Can I manage several client sites?
Devices, discovery results and alerts are organized by site inside the tenant workspace. You can move between an overall view and the context of a specific location.
Do I need a NODE appliance?
NODE is optional. It provides a local relay and collection point at a site. Agents can also send telemetry directly to the ingest service.
What does the AI assistant do?
It helps investigate collected device logs using context and log summaries. It requires an AI provider configuration and does not autonomously remediate devices.
How do I start?
Book a demo to map your devices, sites and integrations. The setup and commercial configuration are confirmed against your environment.